<html> <style type=“text/css”> .comment { font-style: italic; color: #c0342d; } .name, .variable, code var, pre var { color: #9e5cb1; } .name { font-weight: bold; } .variable, pre var, code var { font-style: italic; } .keyword { color: #abafb3; } .builtin, .string { color: #417fb8; } .constant { color: #e89f27; } table { margin: 1em auto; } table td { padding: 1pt 4pt; } div.dw-content a { text-decoration: underline; } div.dw-content p, div.dw-content li, div.dw-content li p { font-size: 13pt; margin-bottom: 1em; max-width: 700px; } p code, li code { font-size: 11pt; } blockquote { font-size: inherit; } pre kbd, code kbd { background: inherit; color: inherit; box-shadow: none; padding: 0; font: inherit; font-weight: bold; } a.secret { color: inherit; text-decoration: none !important; } a.secret:hover { text-decoration: underline !important; } </style>
<h1 id=“lab-4-cleaning-table-data”>Lab 4: Cleaning Table Data</h1> <p>23 September 2022</p> <h2 id=“todays-lab”>Today’s lab</h2>
<p>The objective of this lab is to gain familiarity with sanitizing, visualizing, and gaining insights from data.</p>
<p>Up until now, the data that you worked with in lab and on assignments has been sanitized for you – that is, you could expect Pyret to process the data without any extra work.</p>
<p>For this lab, we’ll analyze the data from the survey that you and the other students taking 101 filled out earlier this week. Since the data is being gathered directly from Google Forms submissions, there exists data that either isn’t valid or isn’t useful, and you need to find ways to effectively sort through such cases so that you can gather the insights you need.</p>
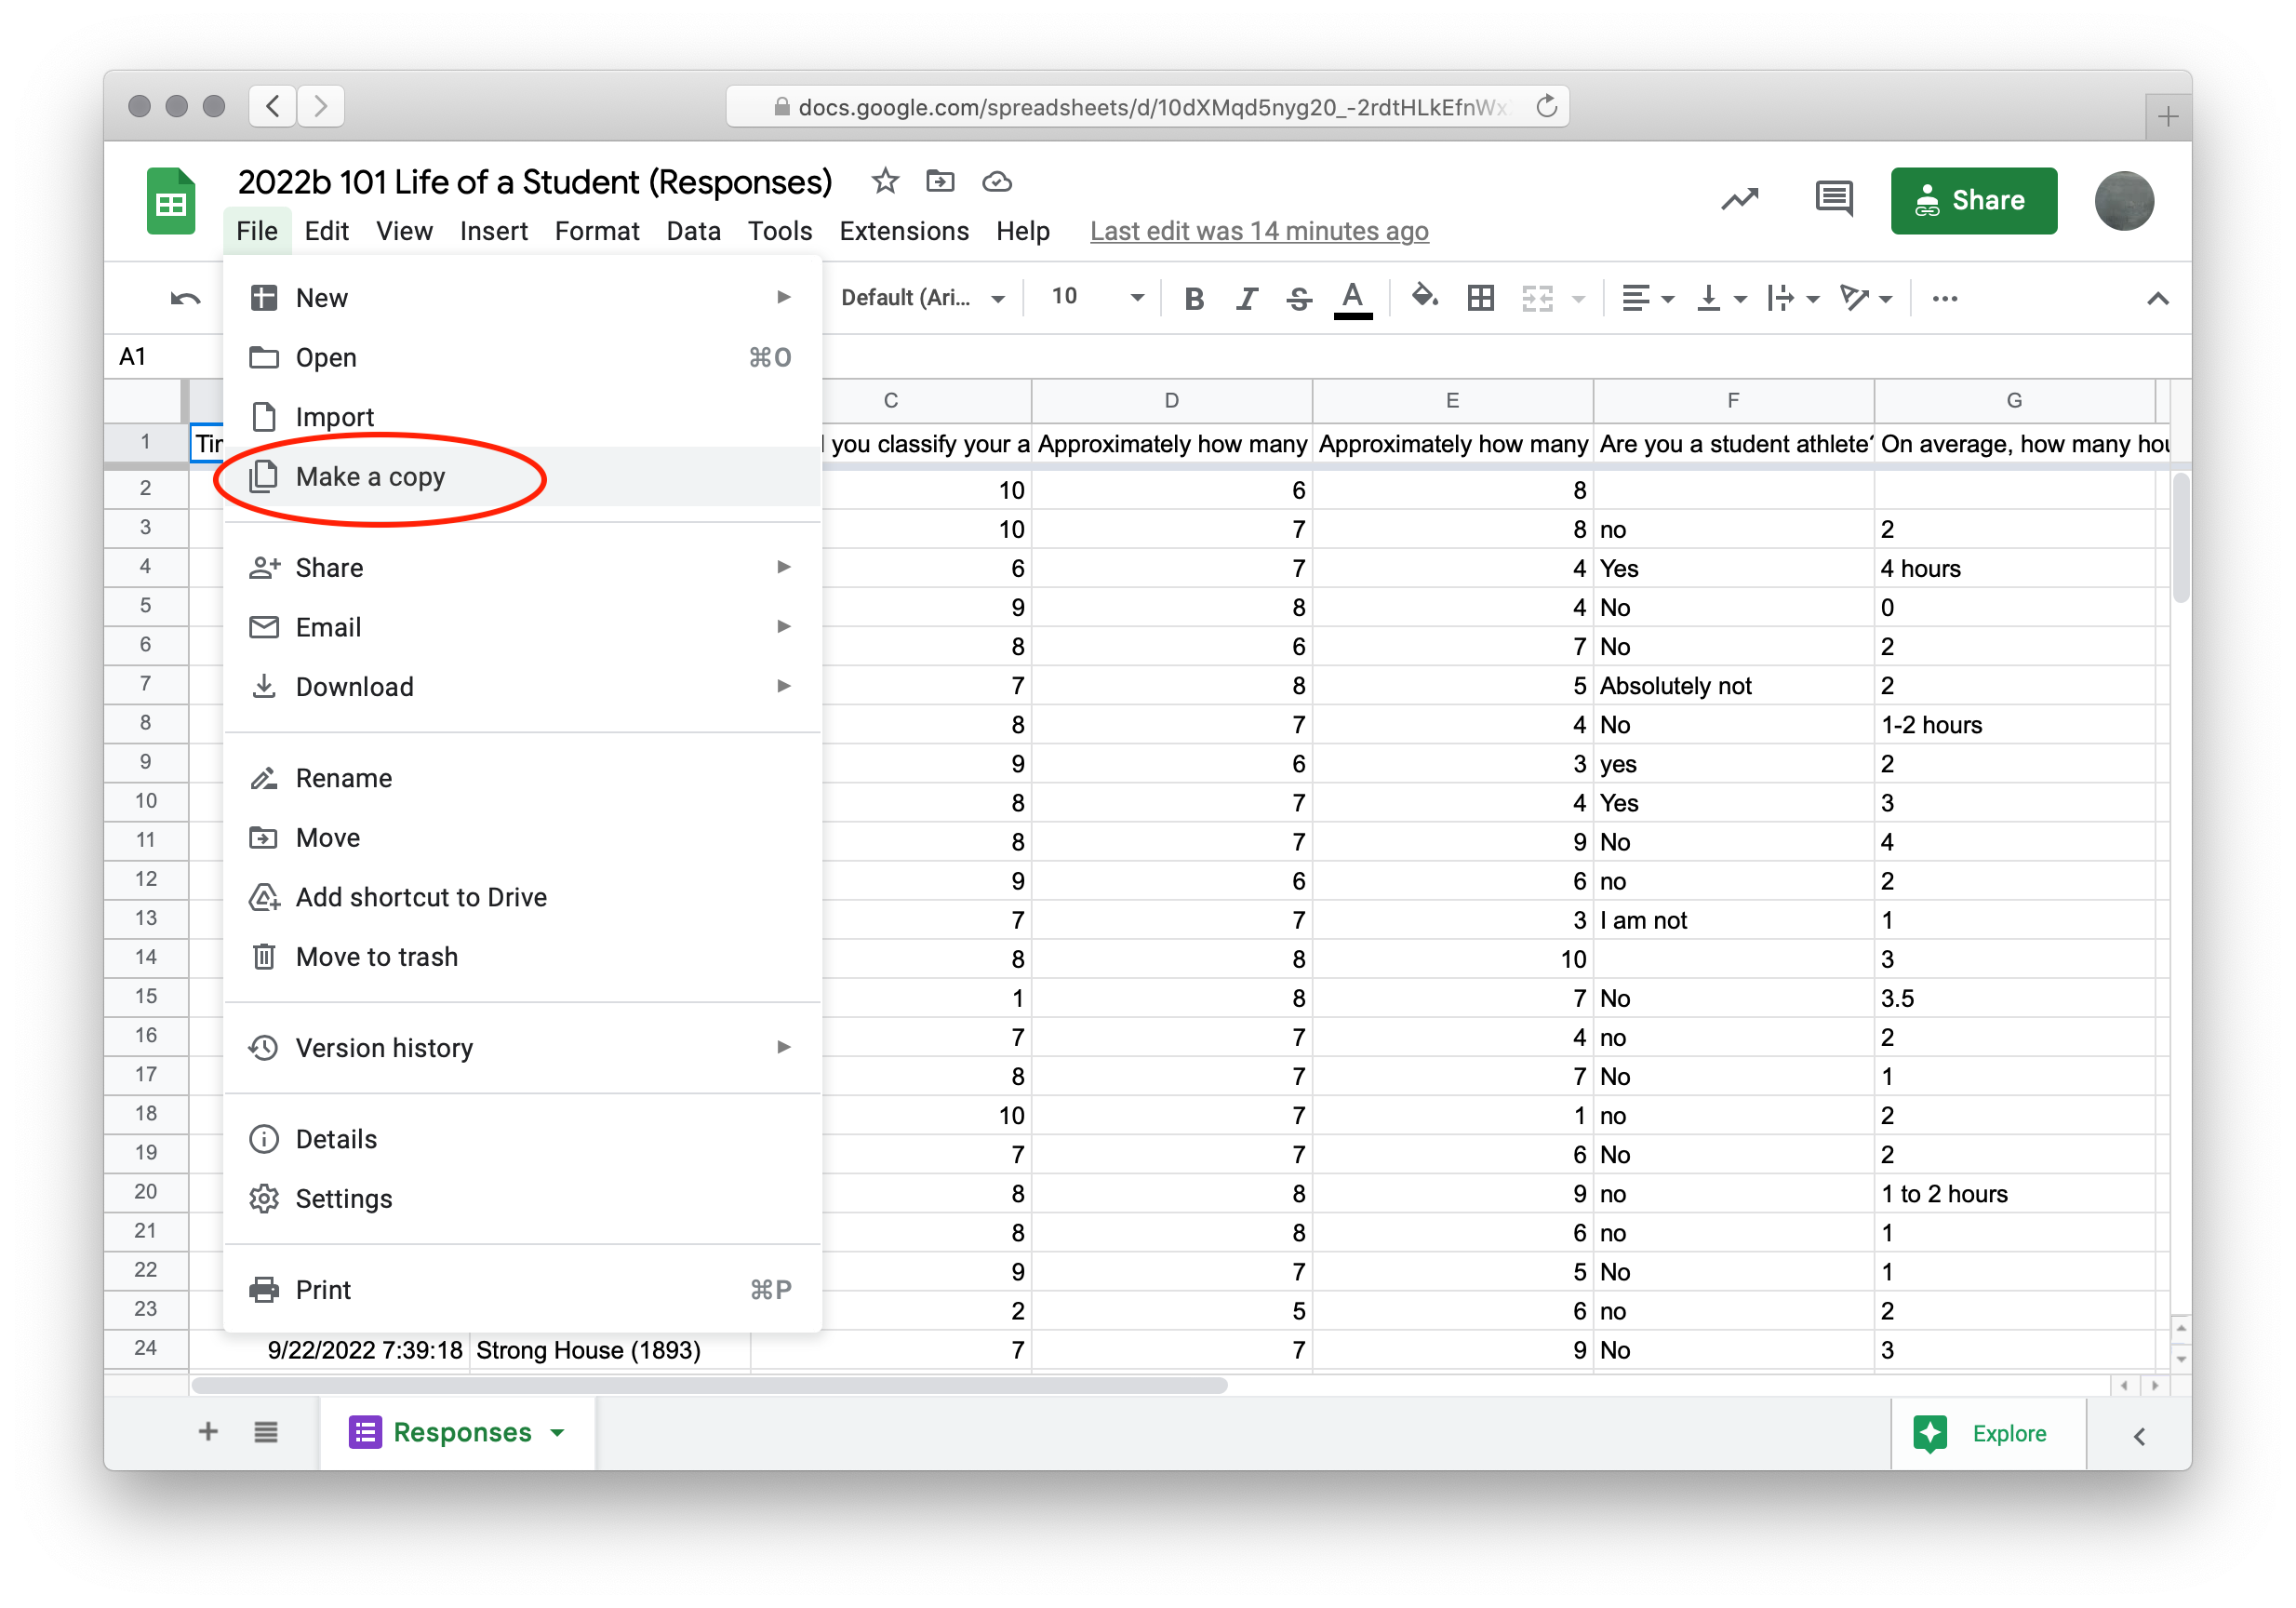
<h2 id=“getting-started”>Getting started</h2> <p><strong>Task</strong>: Go to the <a href=“https://docs.google.com/spreadsheets/d/10dXMqd5nyg20_-2rdtHLkEfnWxXDUhvw4j5_We4ssek/edit?usp=sharing”>response spreadsheet</a> and make a copy of it (by selecting <em>File</em> → <em>Make a Copy</em>).</p>
<img src=“https://www.cs.vassar.edu/~cs101/images/make_a_copy.png” width=“75%”>
<p>This copy of the spreadsheet is yours to tweak manually. There are some values that Pyret will not allow you to read in, which you will have to correct by hand directly in the spreadsheet.</p>
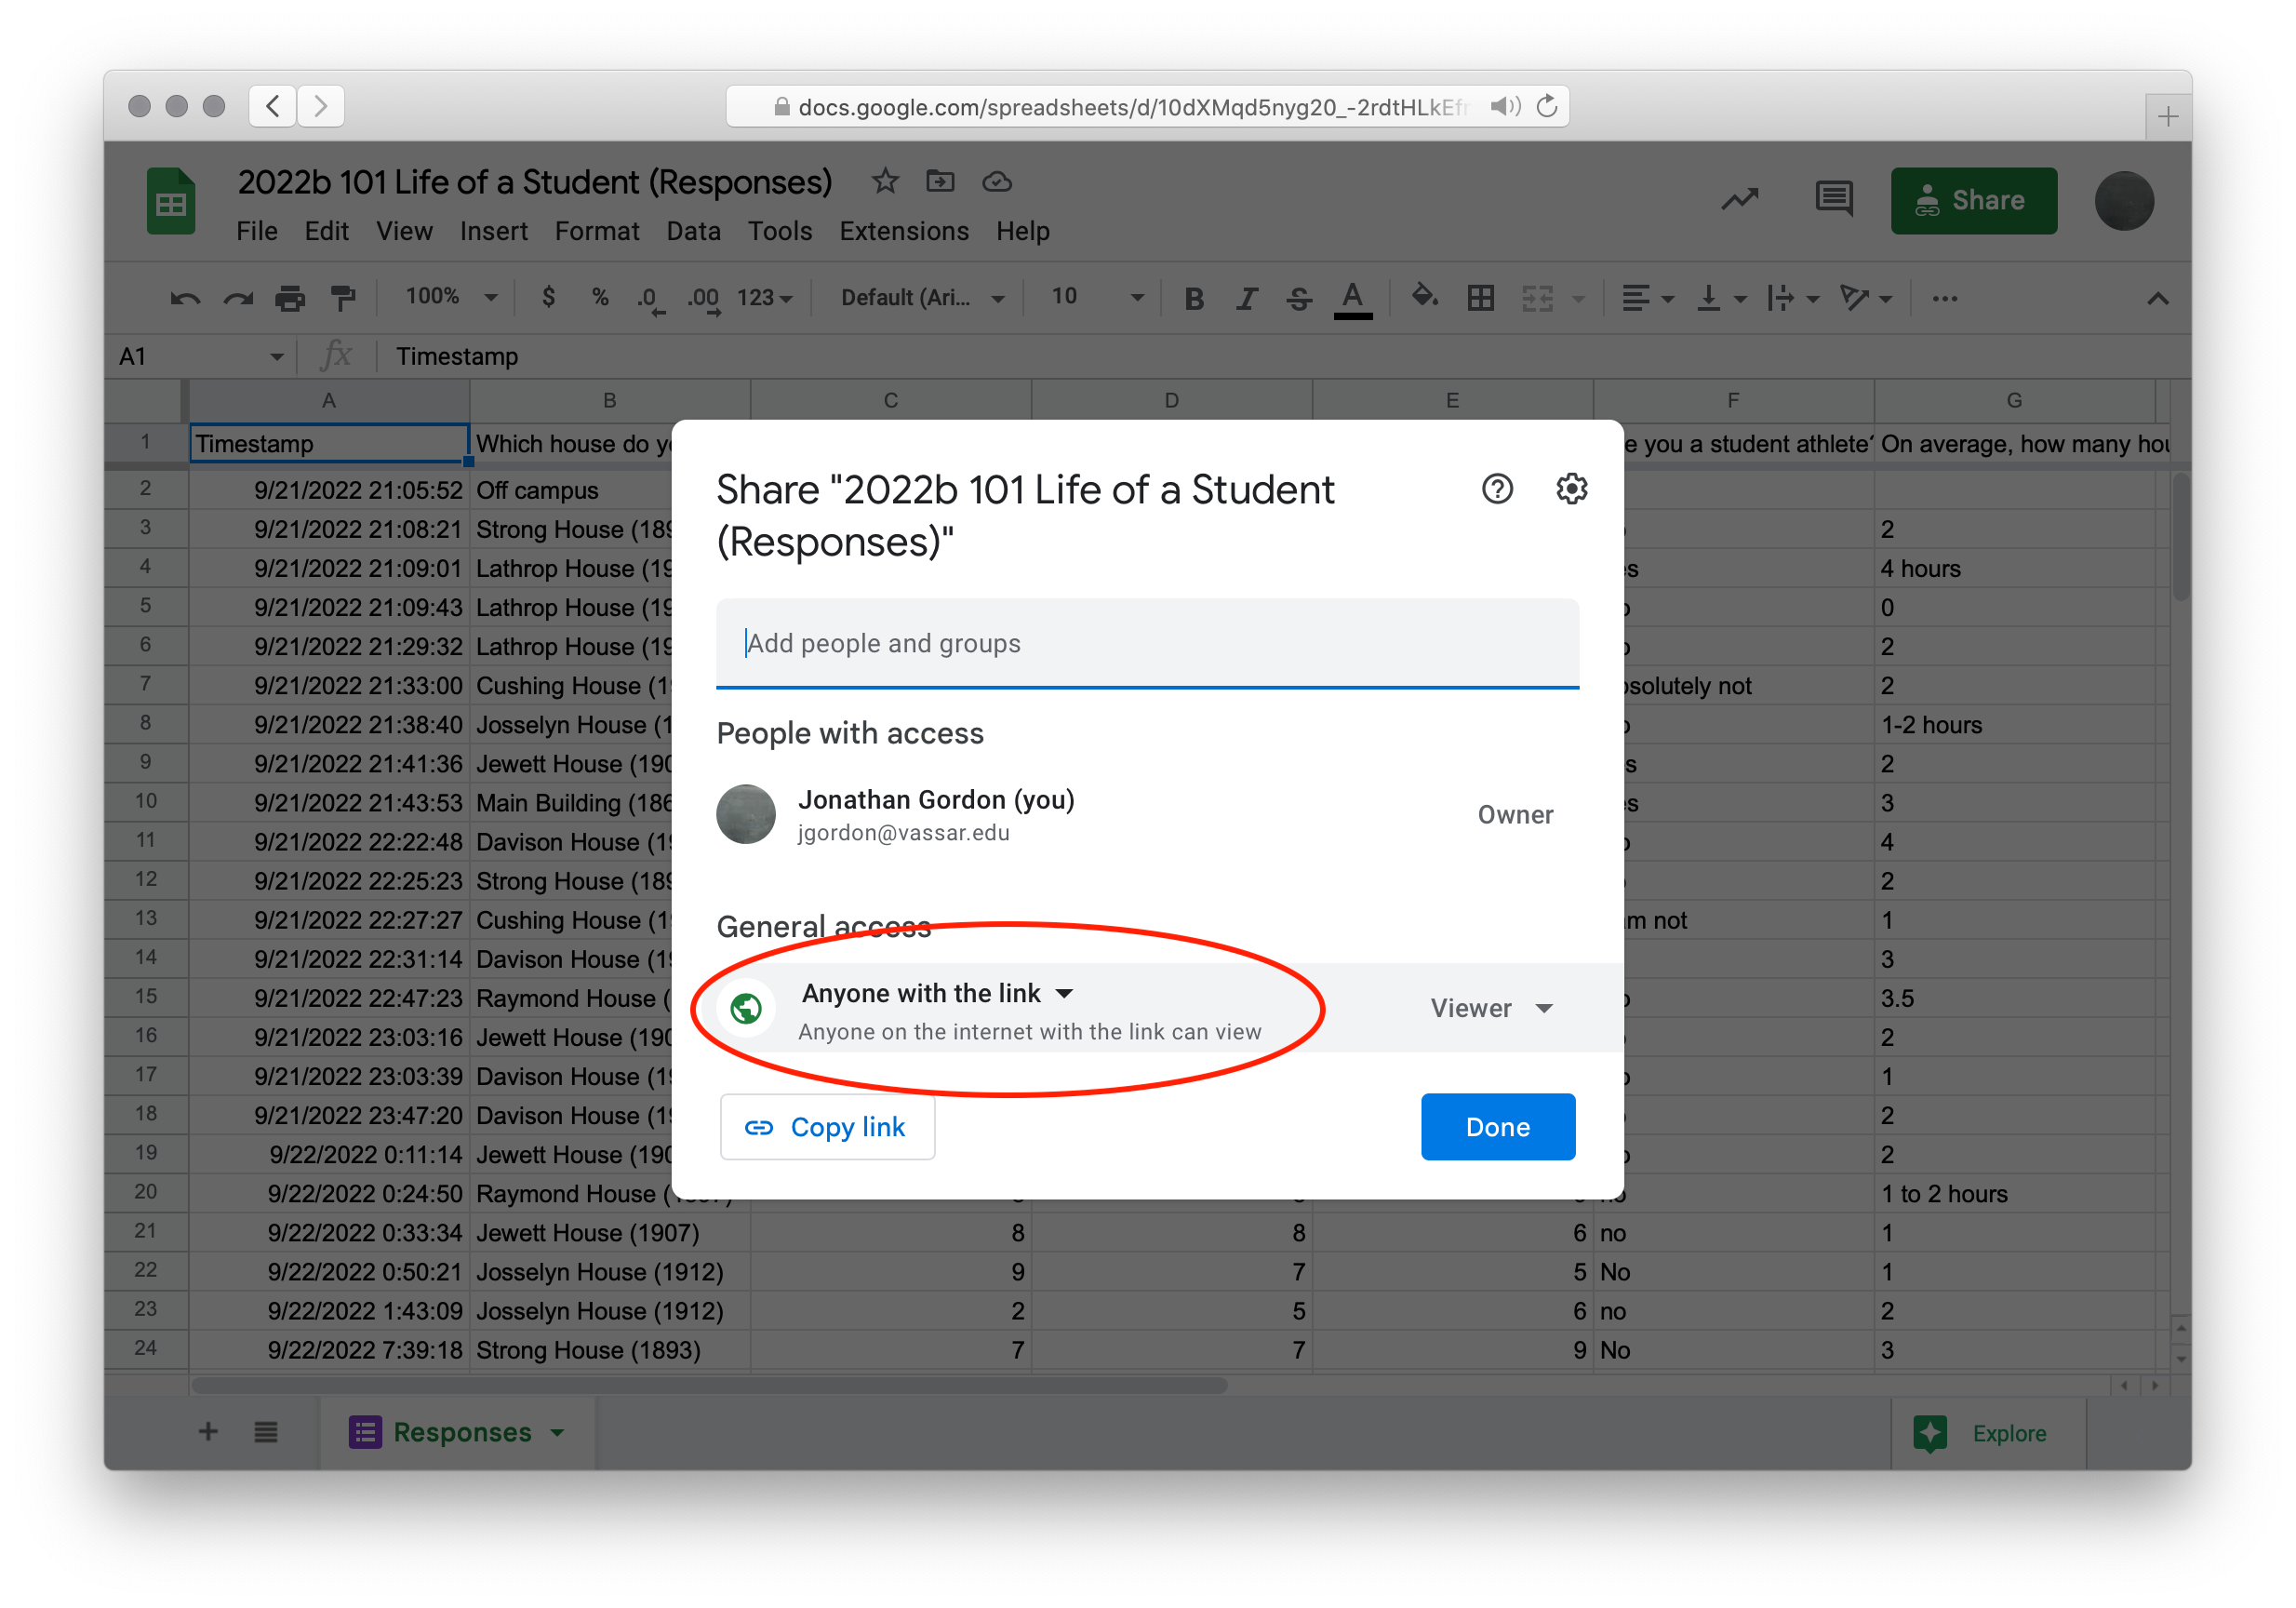
<p>Once you’ve made a copy of the spreadsheet, you need to share the spreadsheet so Pyret can import it.</p>
<p><strong>Task</strong>: Press the green <em>Share</em> button in the upper right hand corner of the spreadsheet, then click on <em>Get link</em> and select <em>Anyone with the link</em> from the dropdown.</p>
<img src=“https://www.cs.vassar.edu/~cs101/images/get_link.png” width=“75%”>
<p>Now we’re ready to import the spreadsheet into a Pyret program.</p>
<p><strong>Task</strong>: Add the following code at the top of your program:</p> <pre>
<span class="keyword">include</span> gdrive-sheets
<span class="keyword">include</span> data-source
<span class="keyword">include</span> shared-gdrive(<span class="string">"dcic-2021"</span>,
<span class="string">"1wyQZj_L0qqV9Ekgr9au6RX2iqt2Ga8Ep"</span>)
<var>ssid</var> = <span class="string">""</span> <span class="comment"># Put the ID of your spreadsheet here</span>
<var>data-sheet</var> = load-spreadsheet(ssid)
<var>student-data</var> =
<span class="keyword">load-table</span>:
timestamp, house, stem-level, sleep-hours,
schoolwork-hours, student-athlete, extracurricular-hours
<span class="keyword">source</span>: data-sheet.sheet-by-name(<span class="string">"Responses"</span>, <span class="constant">true</span>)
<span class="keyword">sanitize</span> student-athlete <span class="keyword">using</span> string-sanitizer
<span class="keyword">end</span>
student-data
</pre>
<p><strong>Task</strong>: Put the ID of your copy of the spreadsheet in your code above.</p>
<p><strong>Note</strong>: Your
ssid
will look like the highlighted portion of the spreadsheet URL:</p>
<blockquote> <p>
https://docs.google.com/spreadsheets/d/<span style="background: yellow; font-weight: bold">10dXMqd5nyg20_-2rdtHLkEfnWxXDUhvw4j5_We4ssek</span>/edit
</p> </blockquote>
<p>But your
ssid
will be different; don’t use this one!</p>
<p>To make sure the spreadsheet loaded correctly, check that you see the
student-data
table when you run the program. If you are not able to see your table, call your instructor or a coach over to help you troubleshoot.</p>
<h2 id=“part-1-cleaning-the-data”>Part 1: Cleaning the data</h2>
<p>Now that we have the data collected, we need to make sure that the data is clean and processed before we analyze it.</p>
<h3 id=“exercise-11-data-sanitizing”>Exercise 1.1: Data sanitizing</h3>
<p>Have a look at your
student-data
table. Notice that everything is represented as a string, even the numeric columns. Also notice the values in the last two columns are in the format
some(x)
or
none
.</p>
<p>In order to turn these values into the data types we all know and love –
String
,
Number
, etc. – we need to use the
sanitize
functions when we load the table. See the <a href=“https://dcic-world.org/2022-08-28/processing-tables.html#%28part._missing-data%29”>textbook</a> for an example of how to do this and the <a href=“https://www.pyret.org/docs/latest/data-source.html#%28part._.Pre-defined_sanitizers%29”>Pyret documentation</a> for a list of available sanitizers.</p>
<p><strong>Hint</strong>: You’ll want to use at least
num-sanitizer
and
string-sanitizer
.</p>
<p><strong>Task</strong>: Make a new table called
student-data-sanitized
, which is the same as
student-data
but using the sanitizers.</p>
<p>When you try to sanitize the
extracurricular-hours
column, Pyret should report one or more errors due to values that can’t be converted to numbers. To fix these sanitizer errors, you’ll have to edit the spreadsheet.</p>
<p>When you need to make edits to the data, it’s much better to edit a <em>copy</em> of the data, leaving the original data unchanged. So, that’s what we’ll do:</p>
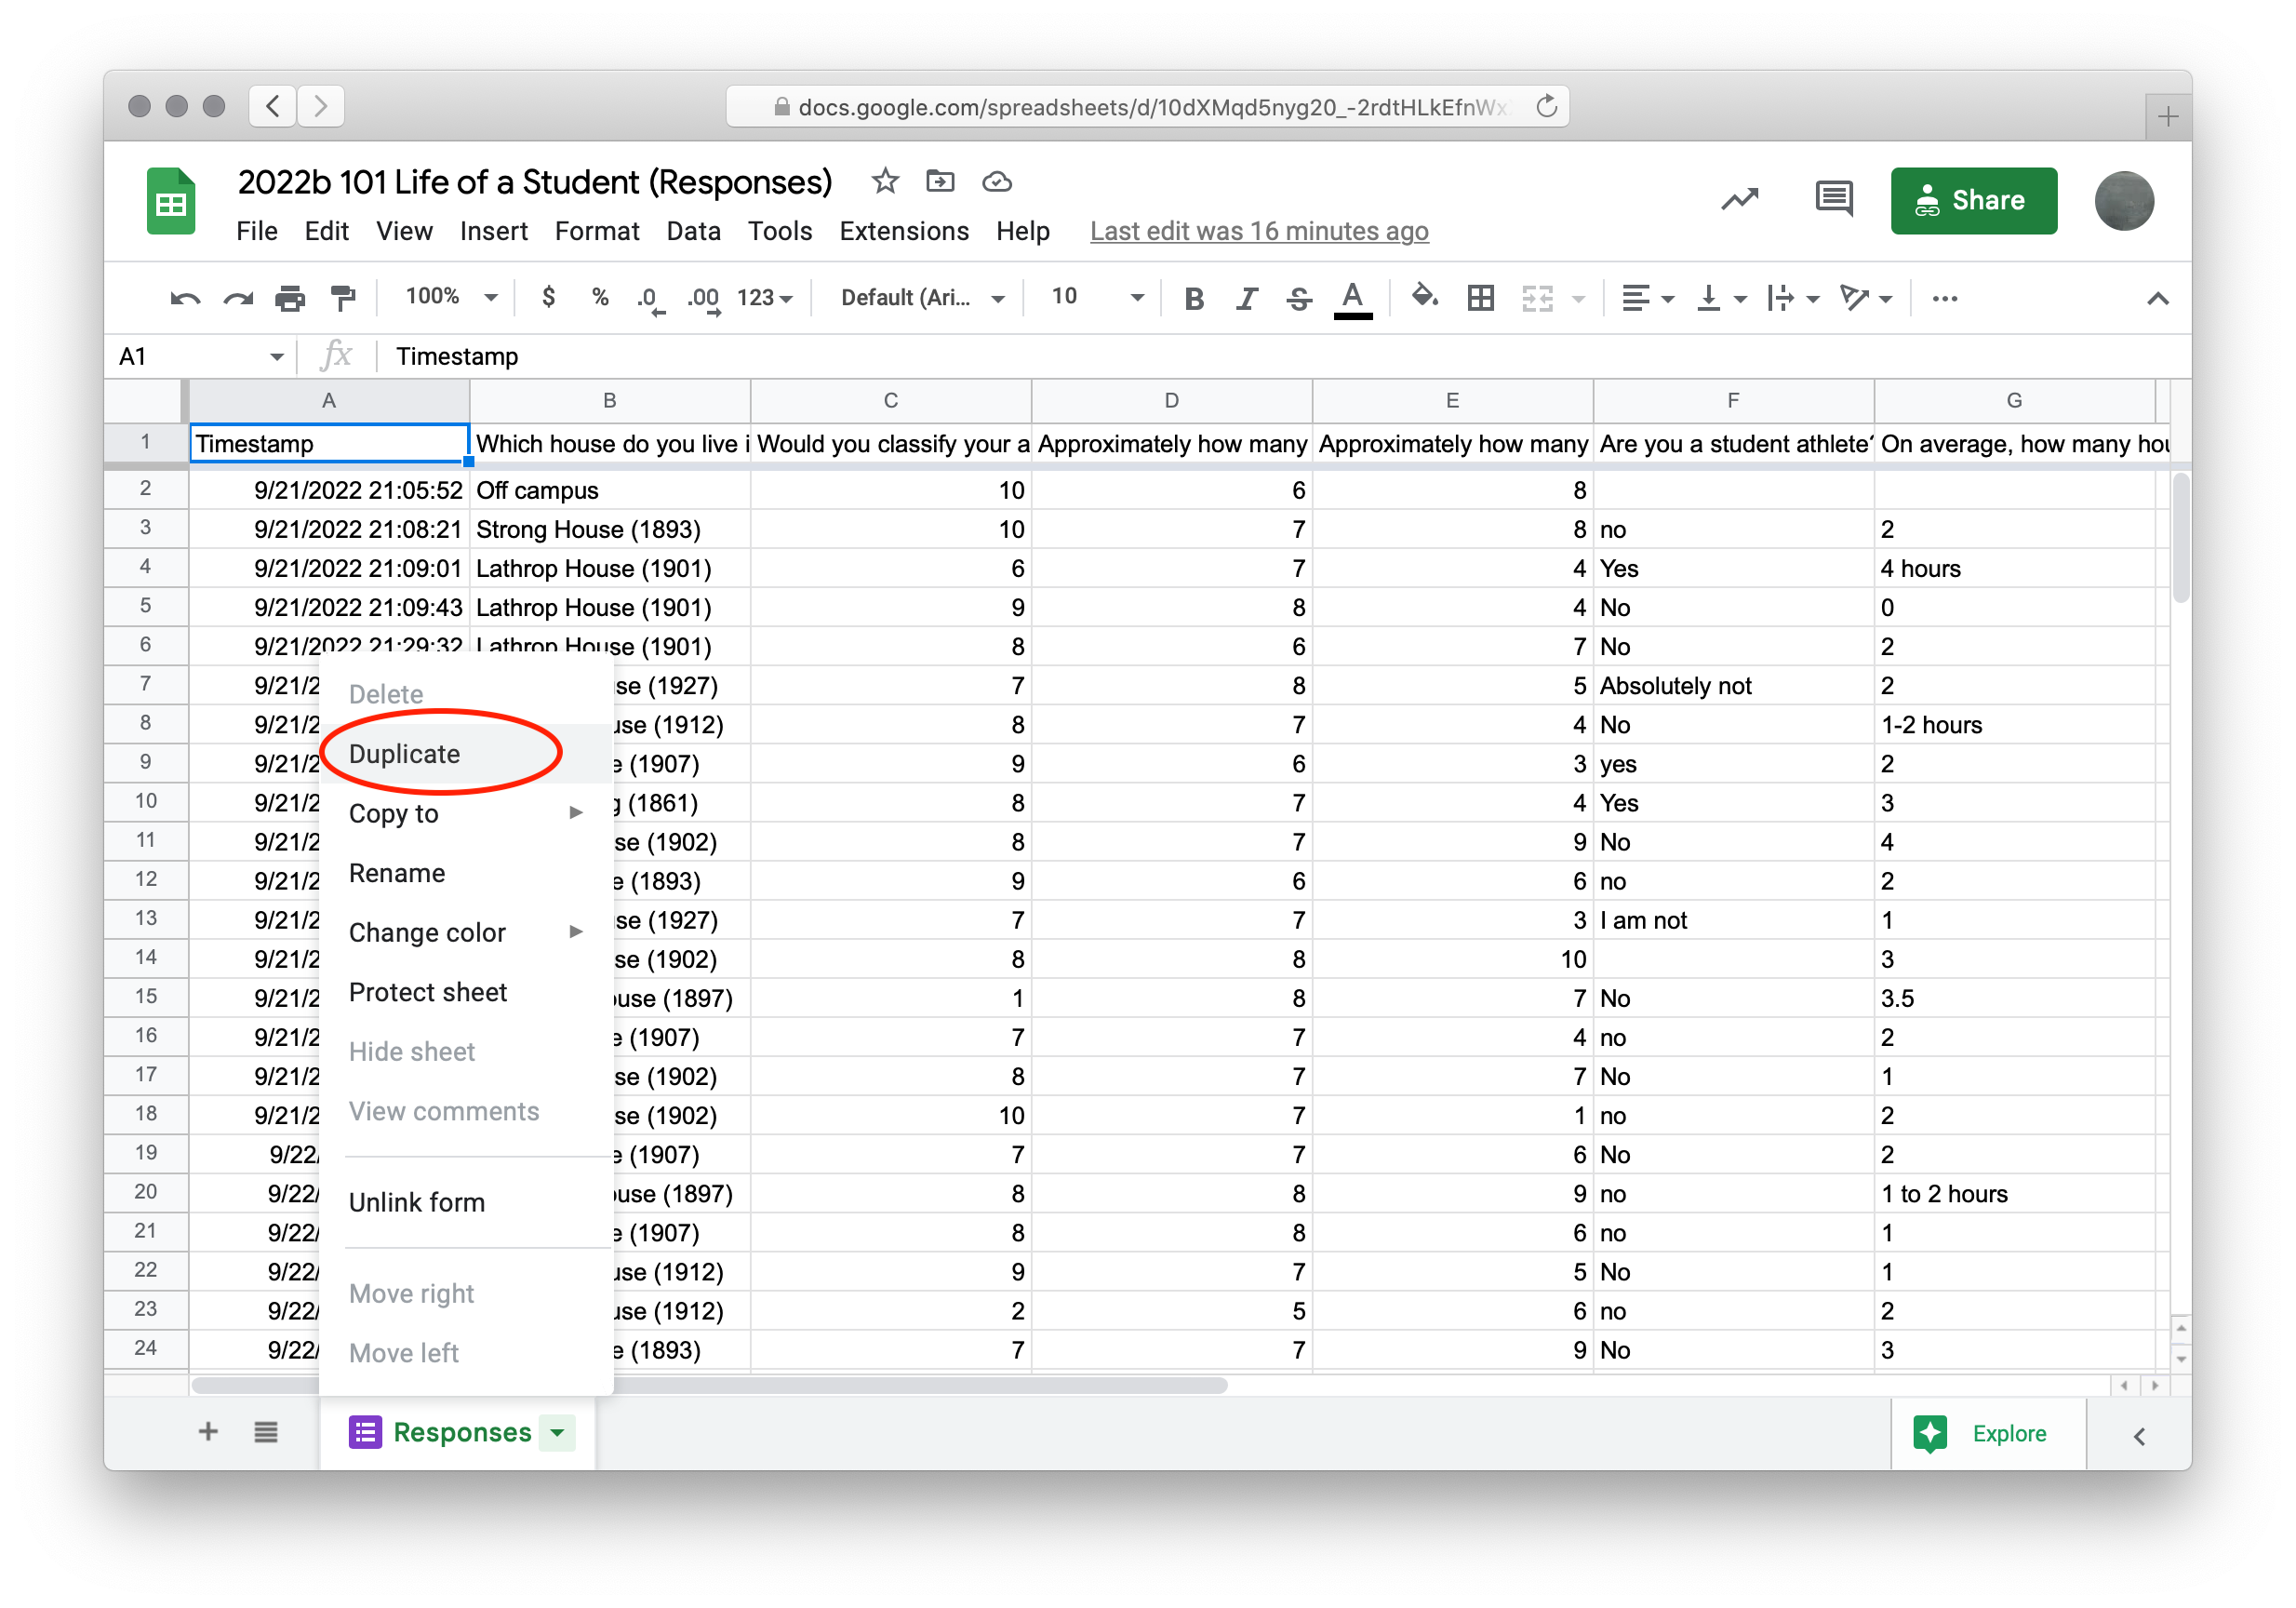
<p><strong>Task</strong>: Copy our data into a new sheet in the spreadsheet by clicking on the small arrow in the <em>Responses</em> tab in the bottom left of the spreadsheet window and then select <em>Duplicate</em>.</p>
<img src=“https://www.cs.vassar.edu/~cs101/images/new_sheet.png” width=“75%”>
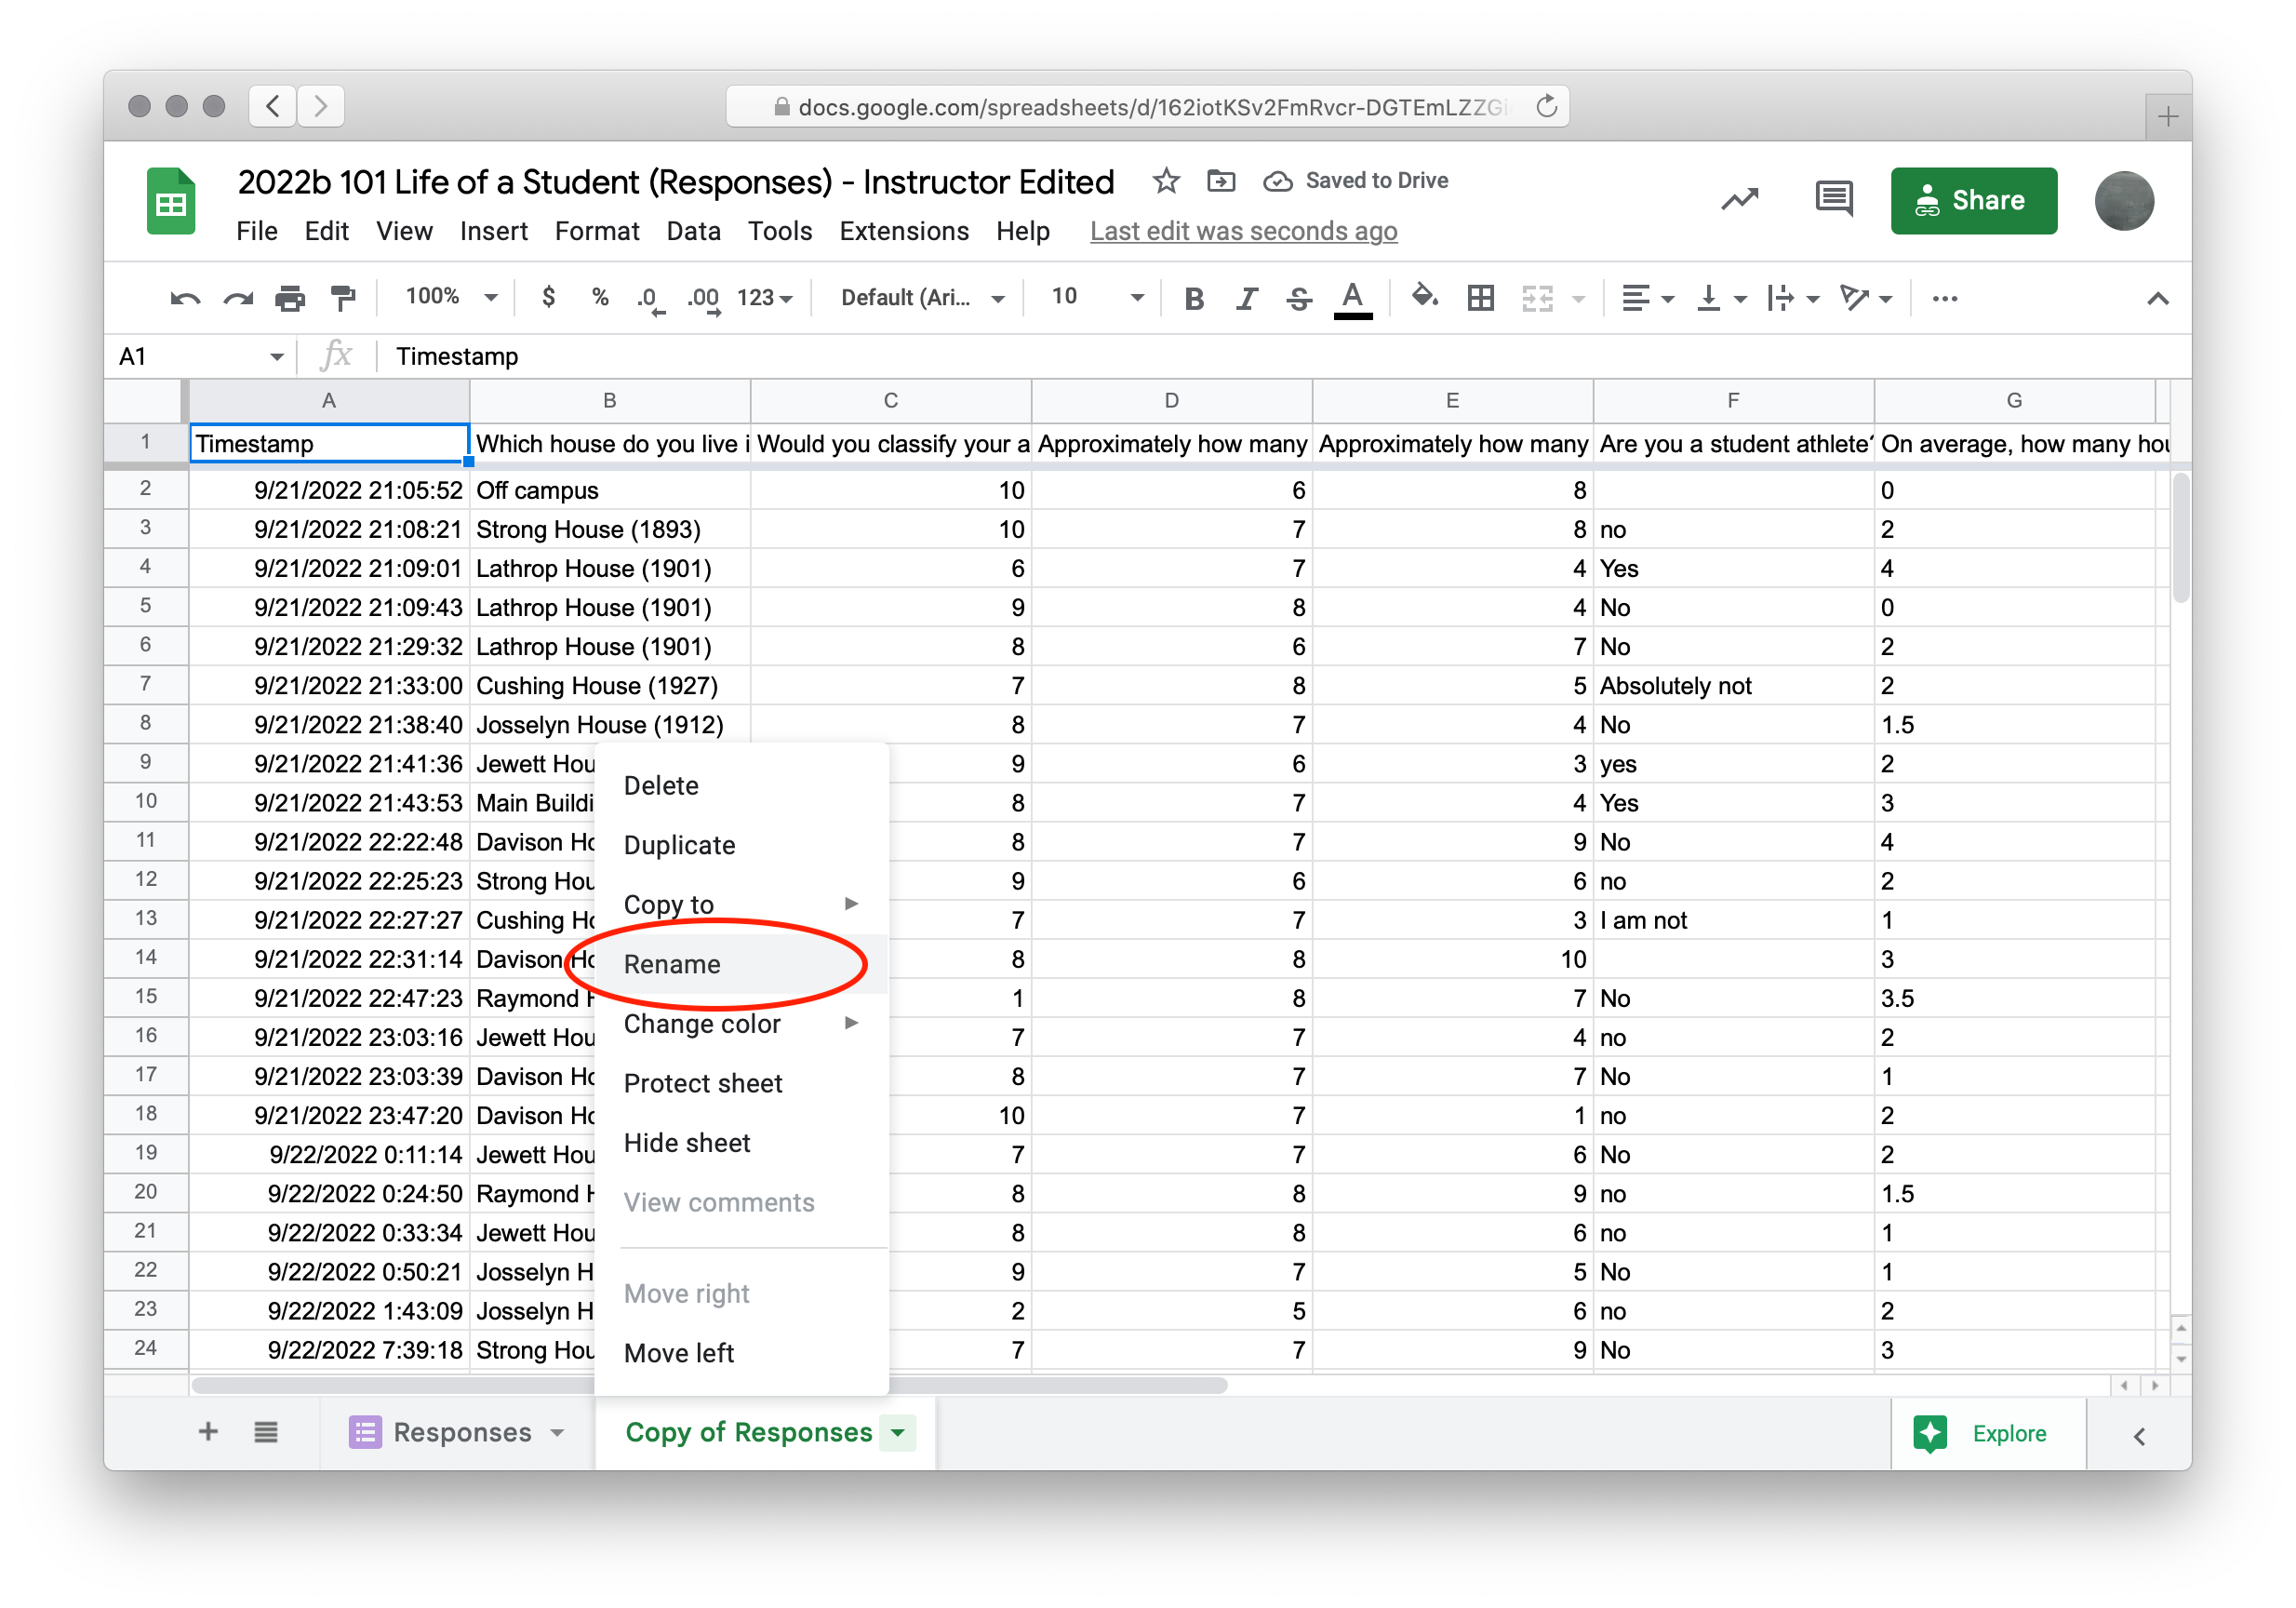
<p><strong>Task</strong>: Once you’ve duplicated the sheet, rename it to “Cleaned Data”.</p>
<img src=“https://www.cs.vassar.edu/~cs101/images/rename_sheet.png” width=“75%”>
<p>Now when you load the spreadsheet to make
student-data-sanitized
, your
source
line will look like this:</p>
<pre>
<span class="keyword">source</span>: data-sheet.sheet-by-name(<span class="string">"Cleaned Data"</span>, <span class="constant">true</span>)
</pre>
<p><strong>Task</strong>: Make edits to the “Cleaned Data” sheet of your spreadsheet until your data passes the sanitizer. If the data for the cell that’s giving an error makes no sense for that cell, it’s best to remove it. However, if there is a clear way clean up the data, you should edit the data for that cell.</p>
<p><strong>Task</strong>: Answer the following question with a block comment (
#| ... |#
) in your code. Make the first line of your comment
Question 1.1
to make it easy for the coach to find your answer.</p>
<p><strong>Question 1.1</strong>: What type of edits did you need to make to the data pass the sanitizer? How did you handle cells that were obviously not correct? How did you handle the other types of errors? Take a look at the “Cleaned Data” sheet in <a href=“https://docs.google.com/spreadsheets/d/162iotKSv2FmRvcr-DGTEmLZZGic_BYeJfUXRUEMpMD8/edit?usp=sharing”>this copy of the spreadsheet</a>, which contains our edits to the table. Do you agree with our edits? Did you do anything different?</p>
<h3 id=“exercise-12-normalizing-the-house-column”>Exercise 1.2: Normalizing the
house
column</h3>
<p>Now that we have our sanitized table, we can now work on normalizing the data in our columns. In the
"house"
column, students were asked to select which one of the nine houses they live in. For students who don’t live in one of those houses, they selected “other” and listed where they live.</p> <p><strong>Task</strong>: Use
transform-column
to normalize this column such that if the answer is not one of the nine Vassar houses, we should change the response to
"OTHER"
.</p>
<p>For reference, the nine houses listed on the form were:</p>
<ul> <li>
"Main Building (1861)"
</li> <li>
"Strong House (1893)"
</li> <li>
"Raymond House (1897)"
</li> <li>
"Lathrop House (1901)"
</li> <li>
"Davison House (1902)"
</li> <li>
"Jewett House (1907)"
</li> <li>
"Josselyn House (1912)"
</li> <li>
"Cushing House (1927)"
</li> <li>
"Noyes House (1958)"
</li> </ul>
<p><strong>Check yourself</strong>: How do you know you did the normalization correctly? You can cross check your data by using the
count
function on your new table. You should only see the nine houses represented in the count table, along with
"OTHER"
. (If there were no responses for a particular house, it won’t show up – this is fine.)</p>
<h3 id=“exercise-13-normalizing-the-student-athlete-column”>Exercise 1.3: Normalizing the
student-athlete
column</h3>
<p>Use the table you created in Exercise 1.2 as your starting point for this exercise.</p>
<p>To normalize the
"student-athlete"
column, we’re going to change it from a
String
to a
Boolean
:</p>
<p><strong>Task</strong>: Make a new table
student-data-cleaned
, where the
"student-athlete"
column is
true
for any response that has
"yes"
(in upper, lower, or mixed case) anywhere in the string and
false
otherwise.</p>
<p>Before you begin, take a moment to write down the tasks that you need to do for this computation. You’ll need to make use of a couple of <a href=“https://www.pyret.org/docs/latest/strings.html#%28part._.String_.Functions%29”>string functions</a> to do this transformation. Also remember that the
transform-column
can return a different type from its input type.</p>
<h2 id=“part-2-analyze-the-data”>Part 2: Analyze the data</h2>
<p>Now that the data has been tidied up, we can start asking questions about it.</p>
<h3 id=“exercise-21-using-count”>Exercise 2.1: Using
count
</h3>
<p><strong>Task</strong>: Use the
count
function to answer the following questions:</p> <ul> <li>What percentage of the survey responders are student-athletes?</li> <li>Which house has the most survey students living there?</li> </ul>
<p>You don’t need to come up with an expression that computes the answer directly; just write your answer in a comment.</p>
<h3 id=“exercise-22-data-visualization”>Exercise 2.2: Data visualization</h3>
<p><strong>Task</strong>: Show a
scatter-plot
which has the
"stem-level"
on the x-axis and
"schoolwork-hours"
on the y-axis. (Refer to the table documentation for plot functions.) Do you notice any correlation between the points?</p>
<p><strong>Task</strong>: Show a histogram of the
"sleep-hours"
column with a
bin-width
of
1
.</p>
<h3 id=“exercise-23-choose-your-own-adventure”>Exercise 2.3: Choose your own adventure</h3>
<p><strong>Task</strong>: Ask and answer at least one more question about the data. Discuss why you wanted to know the answer to that question.</p>
<h2 id=“optional-part-3-going-further”>(Optional) Part 3: Going further</h2>
<p>Congratulations! You have reached the end of lab. Here is an optional exercise in case you are looking for a challenge:</p>
<p><strong>Task</strong>: Write a function
percent-true
that takes a table and column name as input and returns the percent of rows that are
true
for the column specified.</p>
<pre>
<span class="keyword">fun</span> <span class="name">percent-true</span>(t :: Table, col :: String) -> Number: <span class="keyword">doc</span>: <span class="string">"Return the percentage of rows that are true in column 'col'"</span> ... <span class="keyword">end</span>
</pre>
<p>What’s neat about this function is it will work on <em>any</em> table that has a column of type
Boolean
!</p>
<p><strong>Task</strong>: Use this helper function to find the percentage of survey responders who are student-athletes. Check to see if it’s the same answer you got for Exercise 2.1.</p>
<h2 id=“submitting-the-lab”>Submitting the lab</h2> <ul> <li><p>When you’ve completed the exercises, show your code to your instructor or one of the coaches.</p></li> <li><p>Then upload your
lab04.arr
file to the Lab 4 assignment on <a href=“https://www.gradescope.com”>Gradescope</a>.</p></li> </ul>
<h2 id=“just-for-fun”>Just for fun</h2>
<p>When you’re done with the lab, check out these <a href=“https://www.tylervigen.com/spurious-correlations”>spurious correlations</a>. It’s entertaining, we promise!</p>
<h2 id=“acknowledgments”>Acknowledgments</h2>
<p>This lab includes material adapted from Kathi Fisler and colleagues at Brown University and Jason Waterman at Vassar College.</p> </html>